“Sell In May & Go Away” The Hard Truth Behind This Old Market Saying!

Sell In May & Go Away!
<div class="sharethis-inline-share-buttons"></div>
Table of Contents (Jump Links)
Introduction
We’ve all heard the saying “Sell In May & Go Away” but where did it come from? What does it Mean? And most importantly, historically has this been a profitable trading strategy? Lets dive in!
Historical Context
The Corporate Finance Institute has a good write up on the origins of this saying and it’s roots to London.
“Sell in May and Go Away” has its origins in England or, more specifically, in London’s financial district. The original phrase was “Sell in May and go away, come back on St. Leger’s Day,”.
Established in 1776, the St. Leger Stakes is one of the most well-known horse races in England, being the last leg of the British Triple Crown which takes place in September.
Today in the United States the saying lives on with some traders selling out of stocks around Memorial Day (late May) and “Go-Away” until Labor Day (Early September)
Historically the upper class of London and later New York would use this time to escape the heat in the cities and head to cooler climates with their families. Then return in the autumn when cooler weather returned.
How it works
The basic premise of this old strategy is markets tend to do better in the 6 months of November – April than May – October (will be testing this below)
The strategy is you sell in the early parts of May or late spring “Sell In May” and move into cash until November to avoid the May – October period that has historically be a bit slower in markets. Hence the “Go-Away” half of the saying.
What the Data Says (1871-2023)
So lets take a closer look at the data, is this seasonal trend even true? Or is it just an old saying. Also If it is true what would be potentially the best time to sell/ rebuy into markets?
I pulled the S&P data from 1871-2023 this historical data is from ShillerData.com which is the same data set used in the famous and commonly used Shiller Index. It’s a well know data set that’s generally accepted as being reliable. I will be excluding dividend returns from my calculations and only evaluating market returns as dividend yields don’t tend to change much month to month, also their irregular payout schedule may skew results.
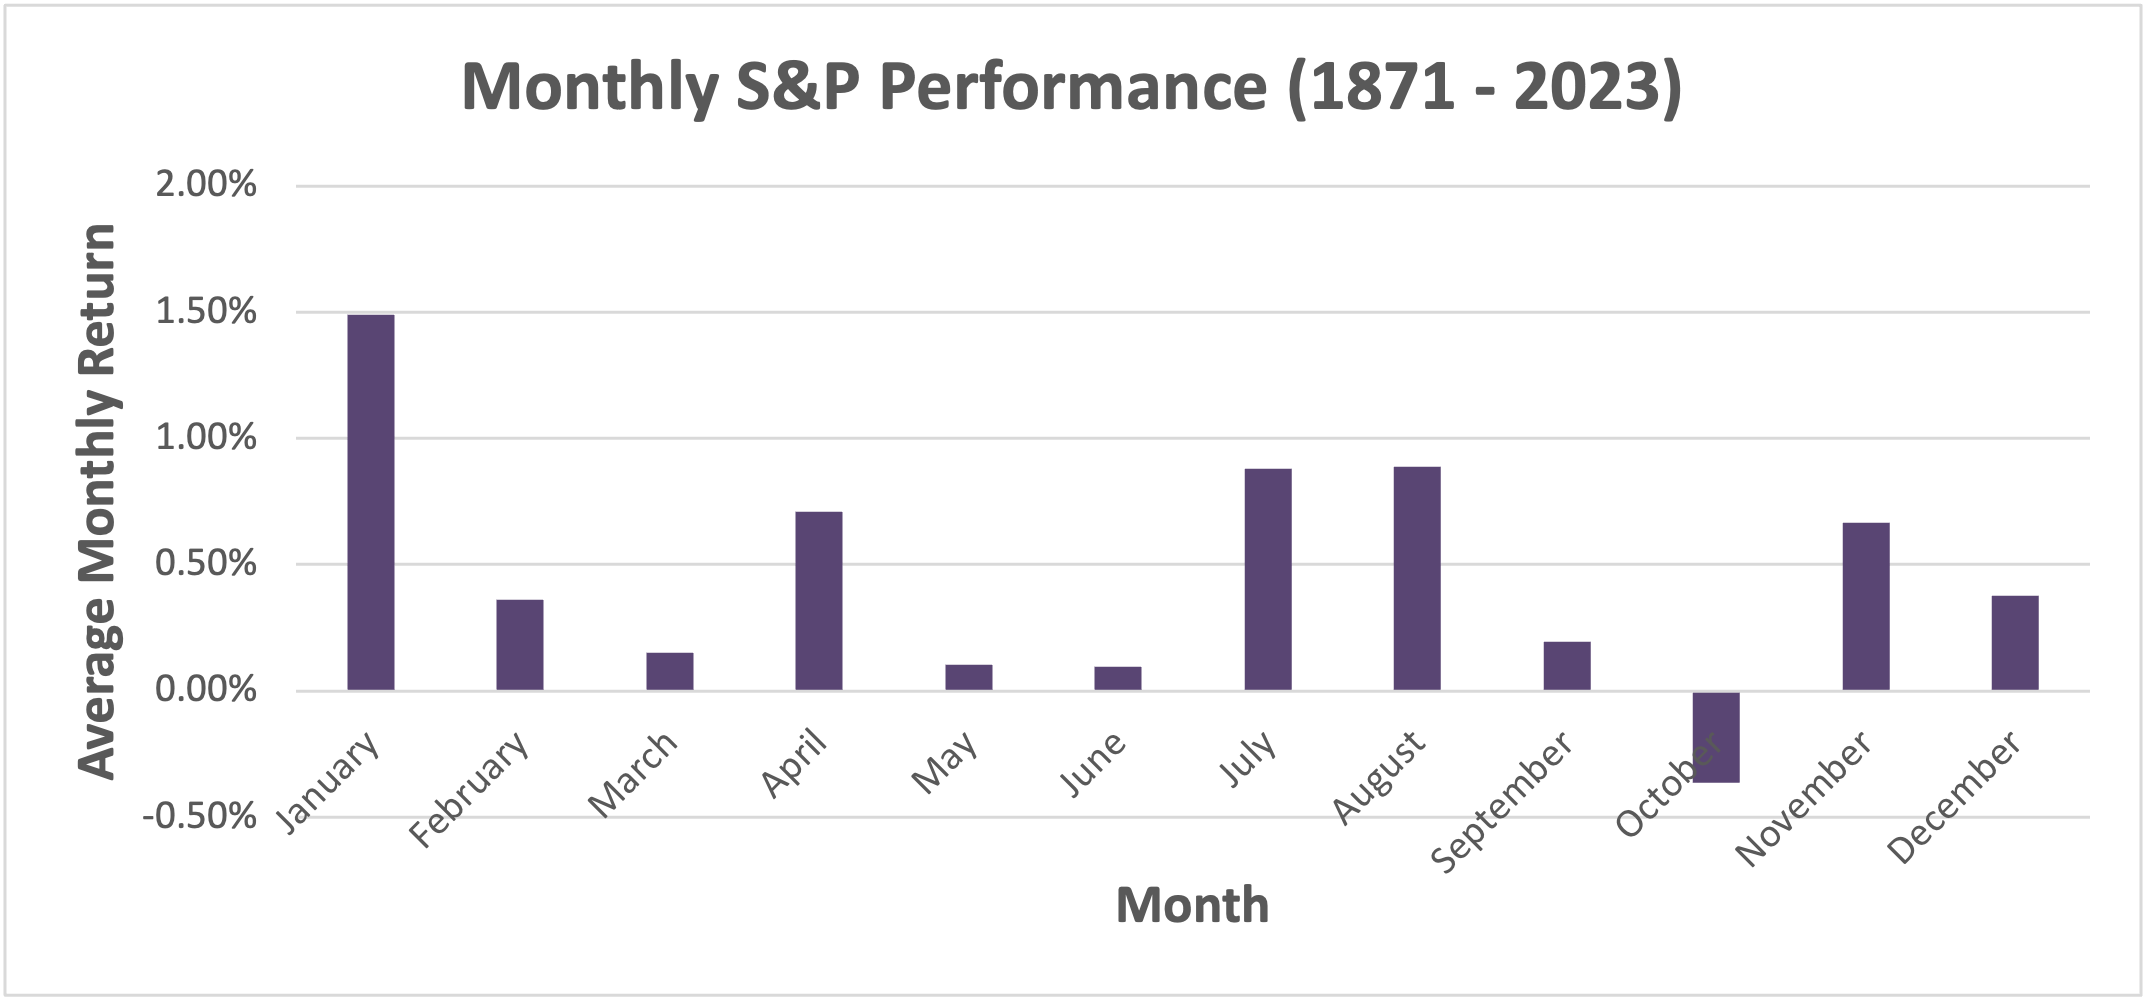
Average Monthly Returns (1871-2023)
Average Monthly Returns 1871-2023
Turns out there might be something to this old saying.
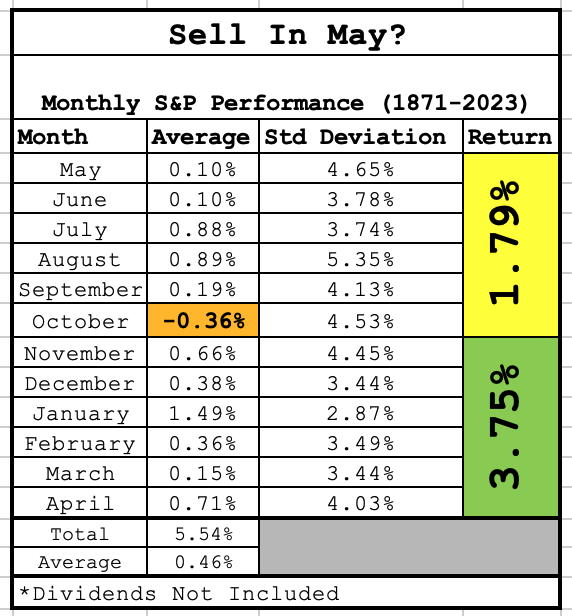
Historically speaking since 1871-2023 the 6 month period from November - April has returned 3.75% while the 6 month period of May – October only returned 1.79% or about half. Note this figure averages out to 5.54% annually, not including dividends over this time period.
This is pretty interesting, however does it really make sense to move to cash? Afterall the markets were still positive from May – October.
I’d argue probably not. For 3 main reasons.
Selling stocks has tax implications.
You miss out on 2 full quarters of dividends which represents a significant part of your returns.
Just because something shows a seasonal trend doesn’t mean there is a consistent pattern. Take a closer look at the table again. Notice the standard deviation is much larger than the observed trend itself. This means in any given year results may very wildly from year to year. Selling in May might actually be missing out on a once in a lifetime rally. We just can’t predict this stuff

Average monthly return with standard deviation (1871-2023)

Top 10 best months of US history
As you can see from the above chart, 7 of the 10 best months in US market history actually happened in the May – October time period. It would be a shame to miss out on those!
Overall the results are interesting and certainly indicate a pattern over the past 152 years.
But similar to my Election Year & Market Performance Analysis Post a pattern with a high degree of variability isn’t a very reliable market predictor for any given year or election cycle for that matter.
The Modern Era (1950-2023)
When I do these posts I like to separate out the “Modern Era” so we can see if there are any changes in performance over time. As the United States hos matured as a country and grown into a super power. The country has structurally changed and it’s reasonable to assume trends may change over long periods of time.
Because of this it is always good to check yoru results to a time period that may more closely represent current conditions. 1950-present is a generally accepted “Modern Era” for the US as it came out of WWII as a major world wide economic force.
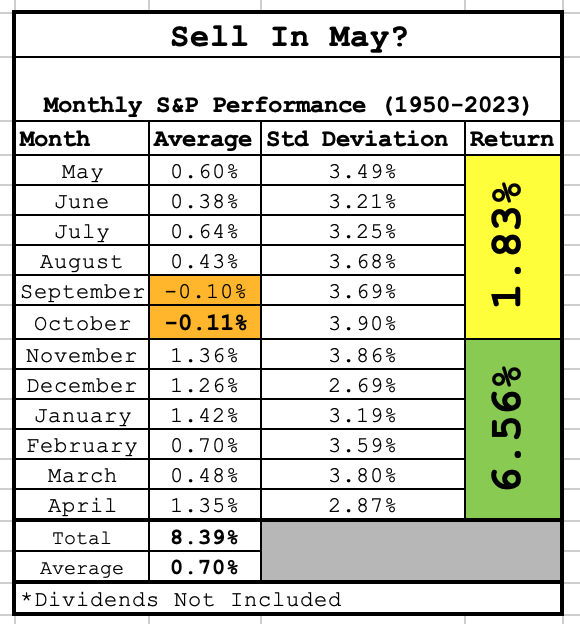
Average Monthly Returns (1950-2023)
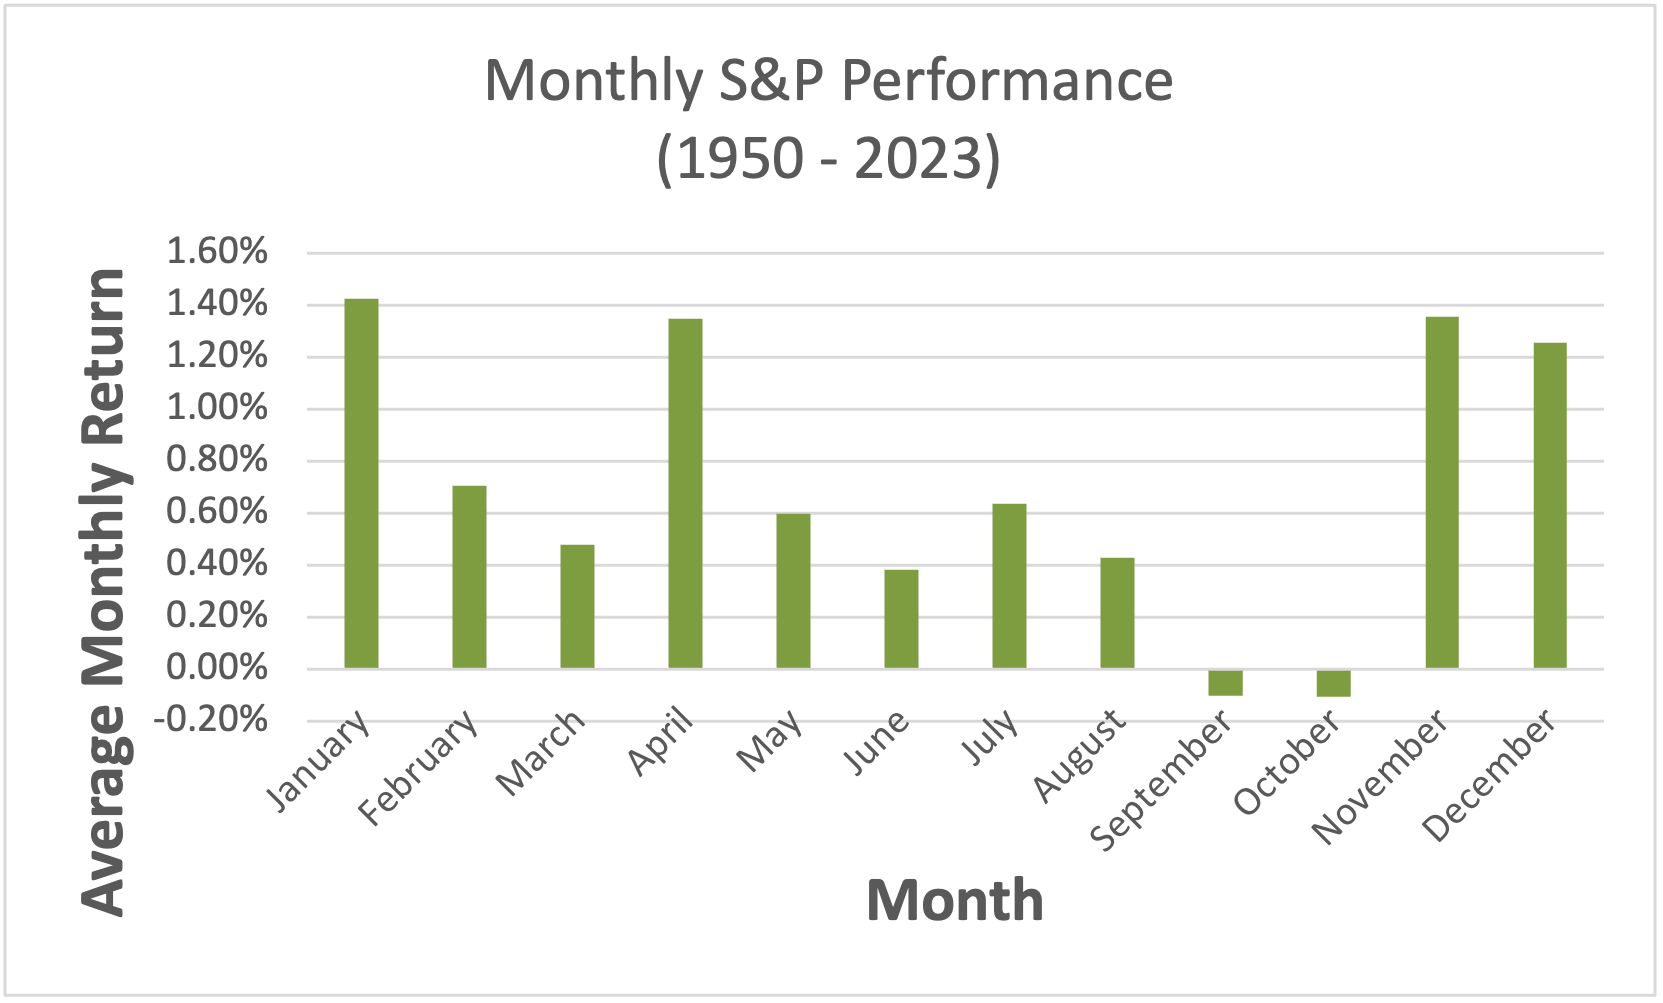
Average Monthly Returns (1950-2023)
As we can see from the table and graph above the May – October time period averages 1.83% and the November – April time period returns 6.56% or more than 3X! A pretty convincing pattern!
However like before I personally wouldn’t want to sell in May. I’d be giving up 2 quarters worth of dividend payments, need to manage the tax bill and 1.83% for 6 months is still a positive return.
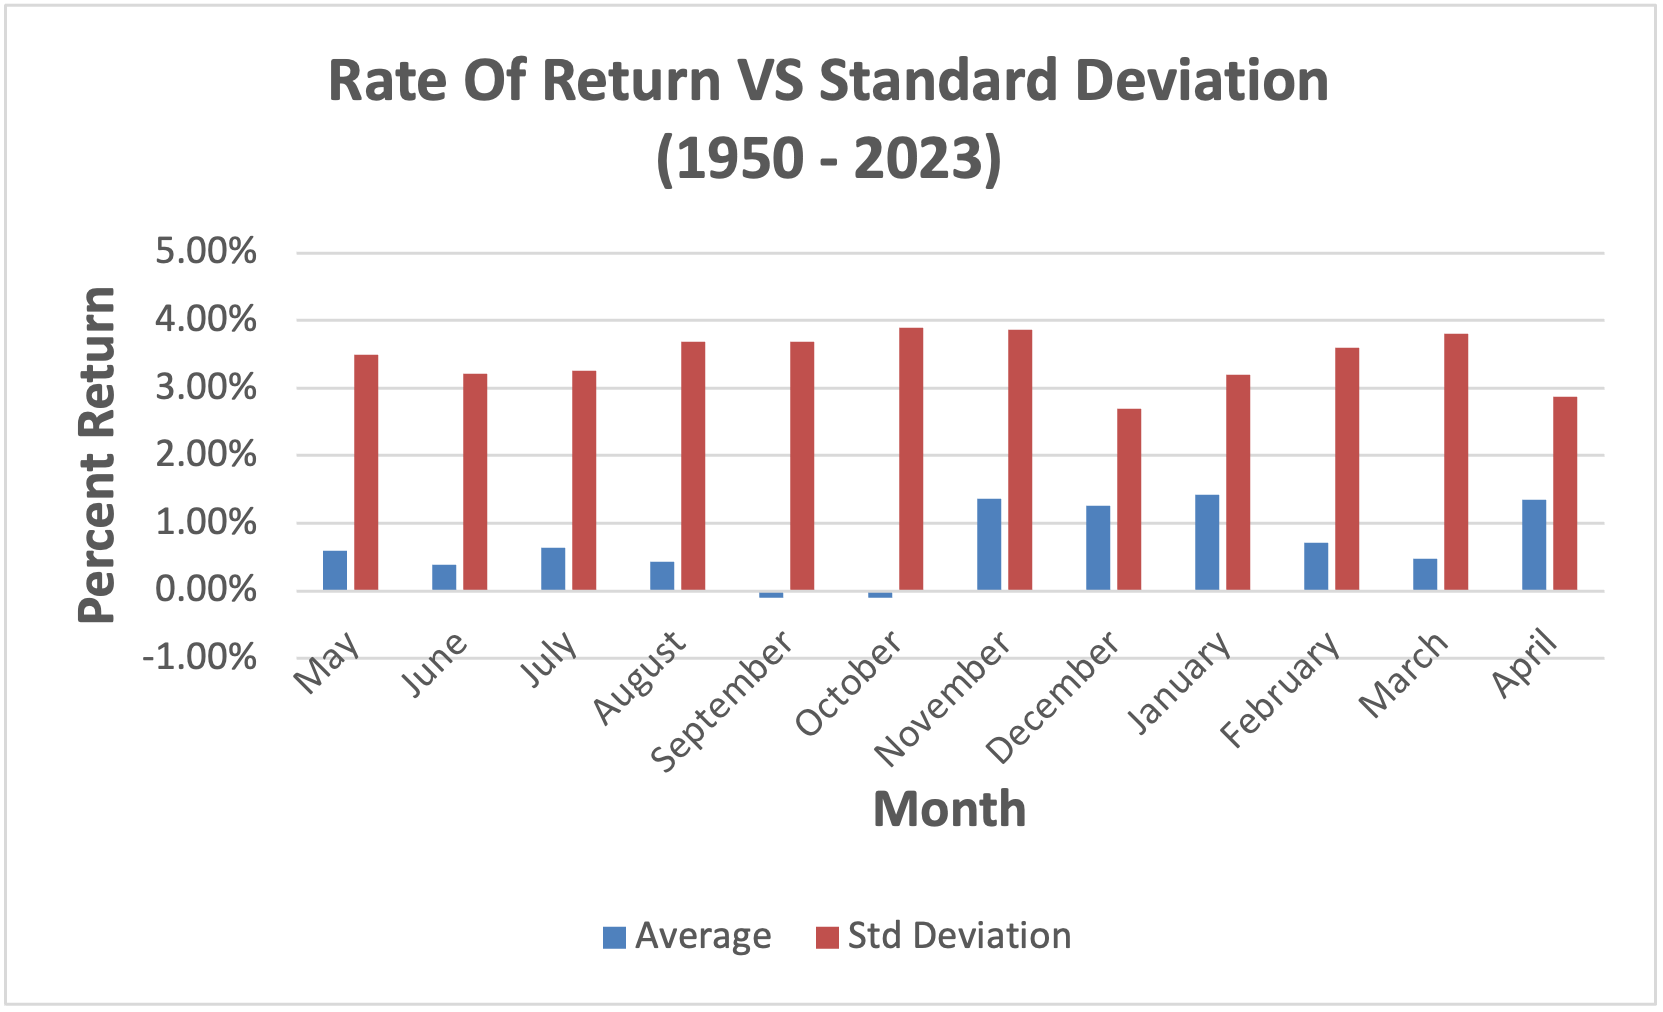
Average monthly return with standard deviation (1950-2023)
As far as the standard deviation it seems that it’s a little more consistent in the 1950-2023 time period but still orders of magnitude larger than the average monthly return so not a trend strong enough to trade off of.
Conclusion
Overall the old saying “Sell In May & Go Away” holds some water. There is clearly a historical trend over the past 152 years in US markets and the trend has strengthened thru the modern era.
However I don’t think the trend is strong enough to be a useful trade. 7 of the top 10 months in US market history were actually in the May – October period where you would have been in cash which would have been a major bummer.
Also the standard deviation is quite wide when compared to the average monthly returns meaning year to year this trend won’t be very predictable.
This trend is worth thinking about in the broader context if you see a bad October this year, you can be rest assured that October tends to be the slowest month for markets (-0.36% Average) while January historically has been the strongest (1.49% average)
If you enjoyed this article you should check out the my Election Year & Market Performance Analysis Post where I break down how markets tend to behave over the typical 4 year election cycle.
Also don’t forget to subscribe to the newsletter so you don’t miss future articles where I break down common trading “wisdom” and see what the data actually says.